Intracranial pressure measurement
Describe the measurement of intracranial pressure
Accurate measurement of intracranial pressure (ICP) is fundamental in neurocritical care, allowing early detection of intracranial hypertension and guiding therapy.
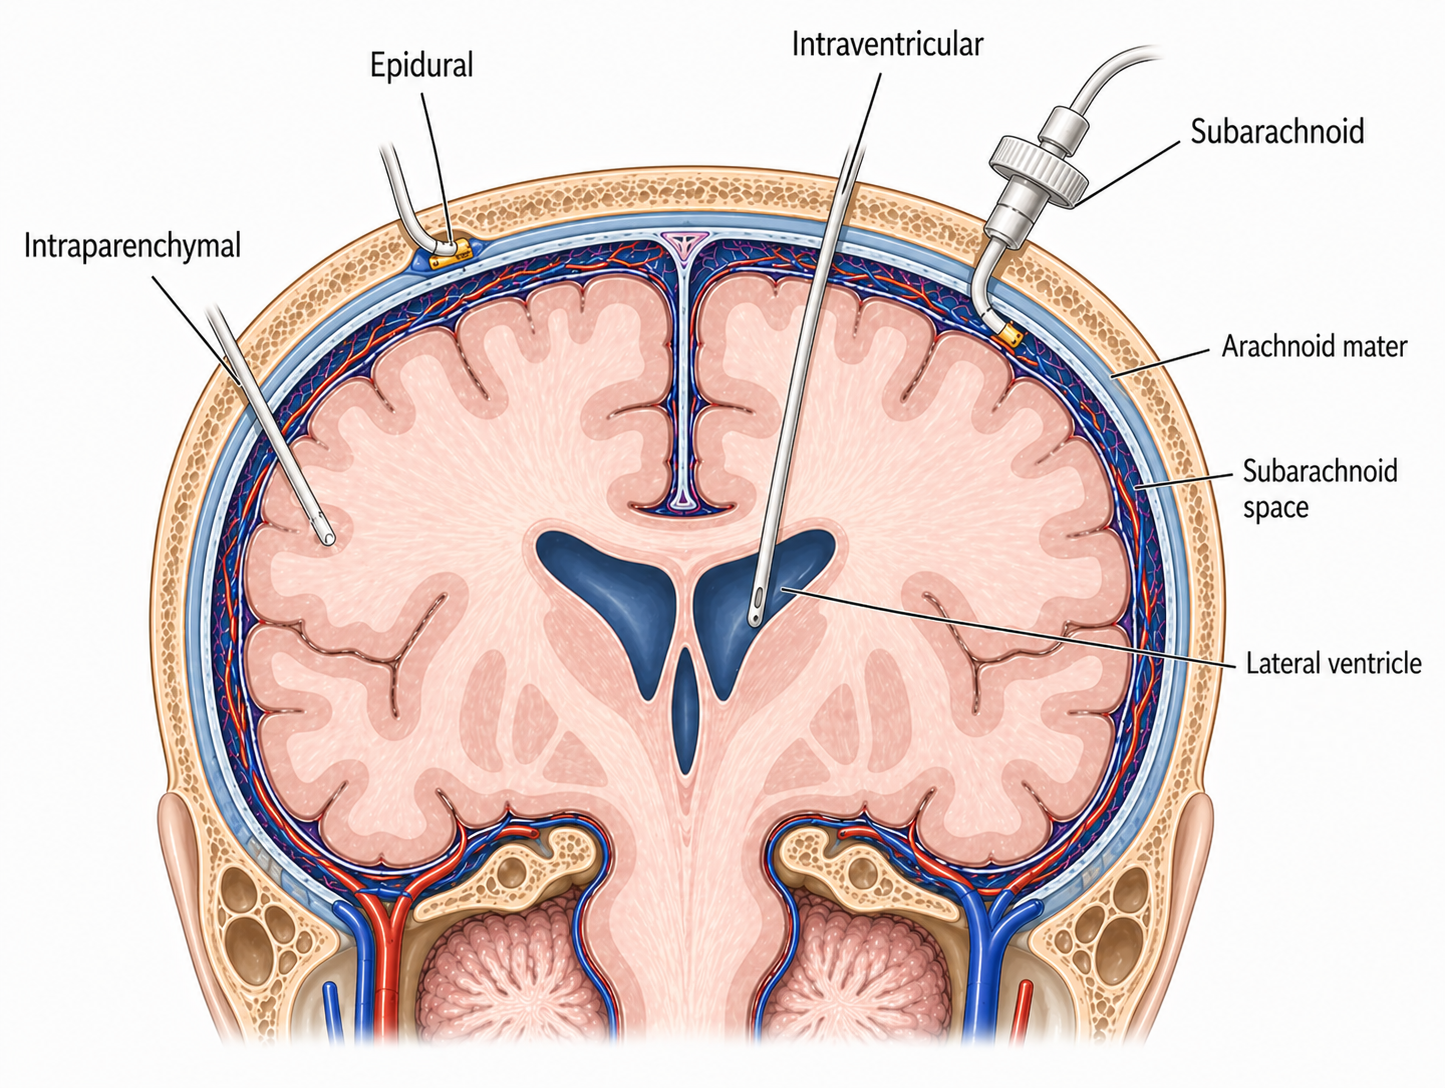
Several monitoring modalities are available, broadly divided into:
- ventricular systems (external ventricular drains)
- intraparenchymal devices (fibreoptic and strain-gauge monitors)
Each technique differs in:
- accuracy and calibration
- ability to provide therapeutic intervention (CSF drainage)
- susceptibility to error and complications
Understanding these differences is essential to selecting the appropriate monitor and interpreting ICP values correctly in clinical practice.
External ventricular drain (EVD)
Feature | External ventricular drain (EVD) |
|---|---|
Components |
|
Mechanism | Ventricular pressure is transmitted via a fluid column to an external transducer, where it is converted into an electrical signal and displayed as ICP waveform and value. |
Benefits |
|
Limitations |
|
Sources of error | Patient:
Operator:
Environment:
Machine:
|
Intraparenchymal ICP monitors
Feature | Fibreoptic ICP monitor | Strain-gauge ICP monitor |
|---|---|---|
Components |
|
|
Mechanism |
|
|
Benefits |
| |
Limitations |
| |
Sources of error | Patient:
Operator:
Environment:
Machine:
| |
Interpreting the ICP waveform
Each cardiac cycle produces three peaks:
-
P1 (percussion wave)
- Represents arterial pulsation transmitted from the choroid plexus
- Normally the highest peak
- Reflects arterial pressure
-
P2 (tidal wave)
- Reflects intracranial compliance
- Sensitive to changes in intracranial volume buffering
- Normally lower than P1
-
P3 (dicrotic wave)
- Corresponds to aortic valve closure
- Smallest peak
Normal waveform
- P1 > P2 > P3
- Indicates normal intracranial compliance
- Arterial pulsations are effectively buffered by:
- CSF displacement
- Venous outflow
Raised ICP / reduced compliance
- P2 increases and may exceed P1
- Indicates reduced intracranial compliance and hence progression toward the decompensated (steep) part of the pressure–volume curve
Other waveform changes:
- Increased overall amplitude of the entire waveform
- Rounded / broadened peaks
- Reduced distinction between P1, P2 and P3
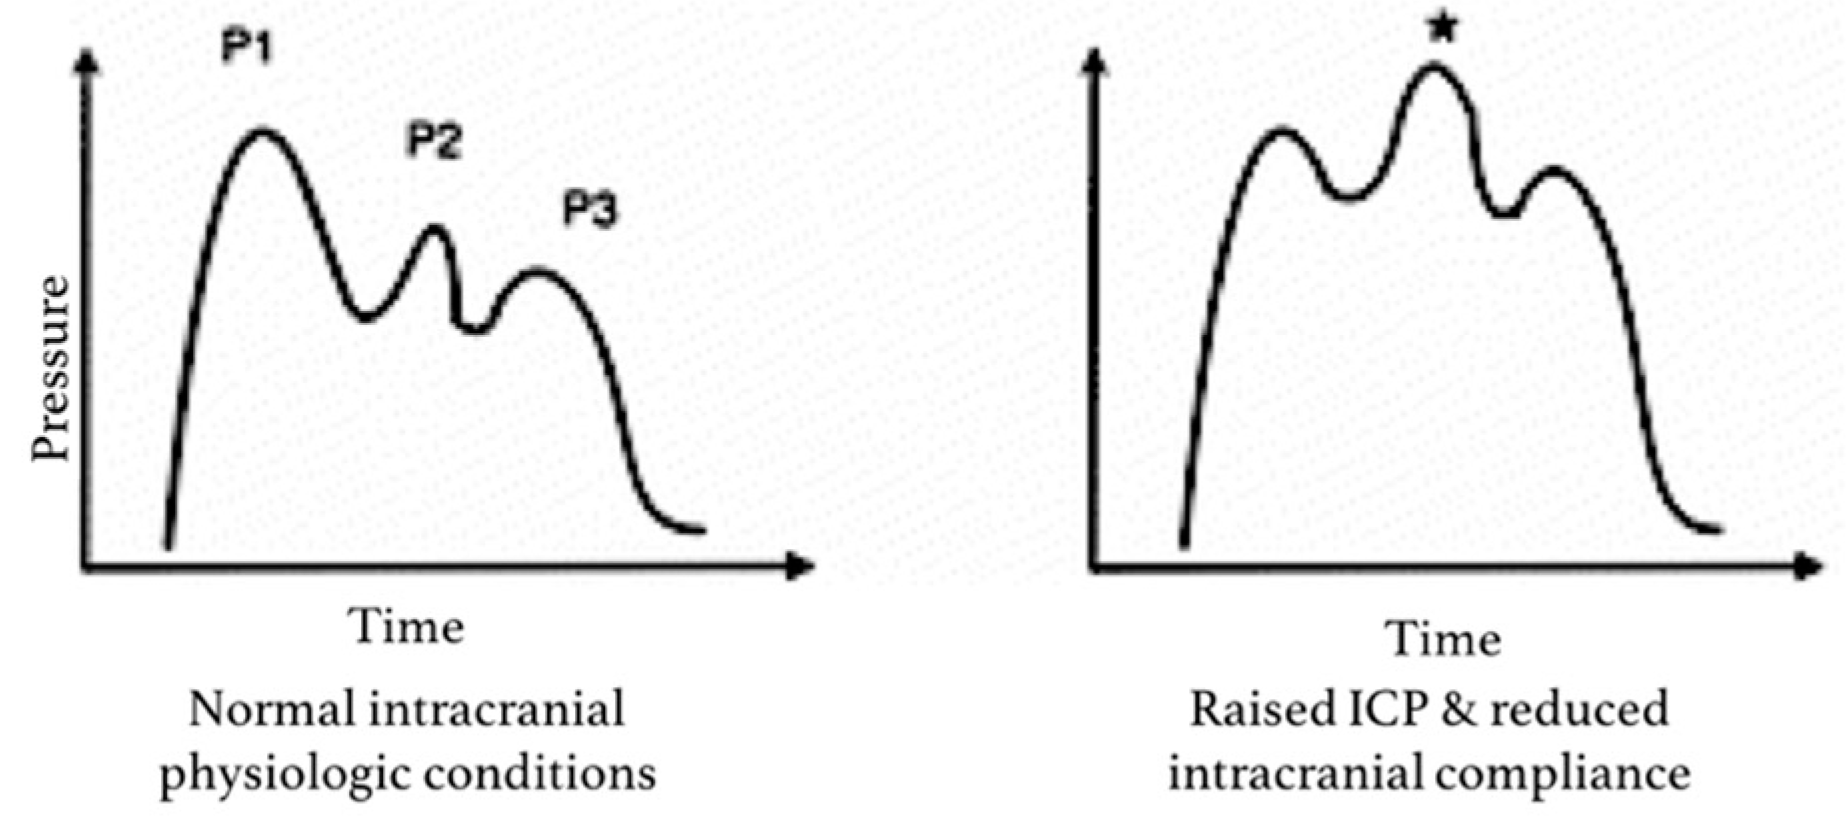
Variation in the ICP waveform with normal or raised pressures
By Harary et al. Intracranial Pressure Monitoring—Review and Avenues for Development.